ThermoFisher SYBR Green Real-Time PCR Problem
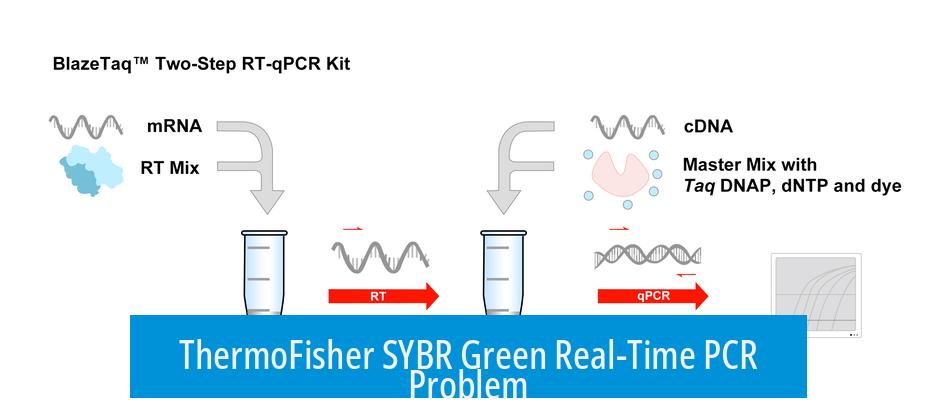
Comparing cycle threshold (Ct) values between SYBR Green and TaqMan assays often leads to confusion due to inherent differences in chemistry and detection methods.
Understanding SYBR Green and TaqMan Assays
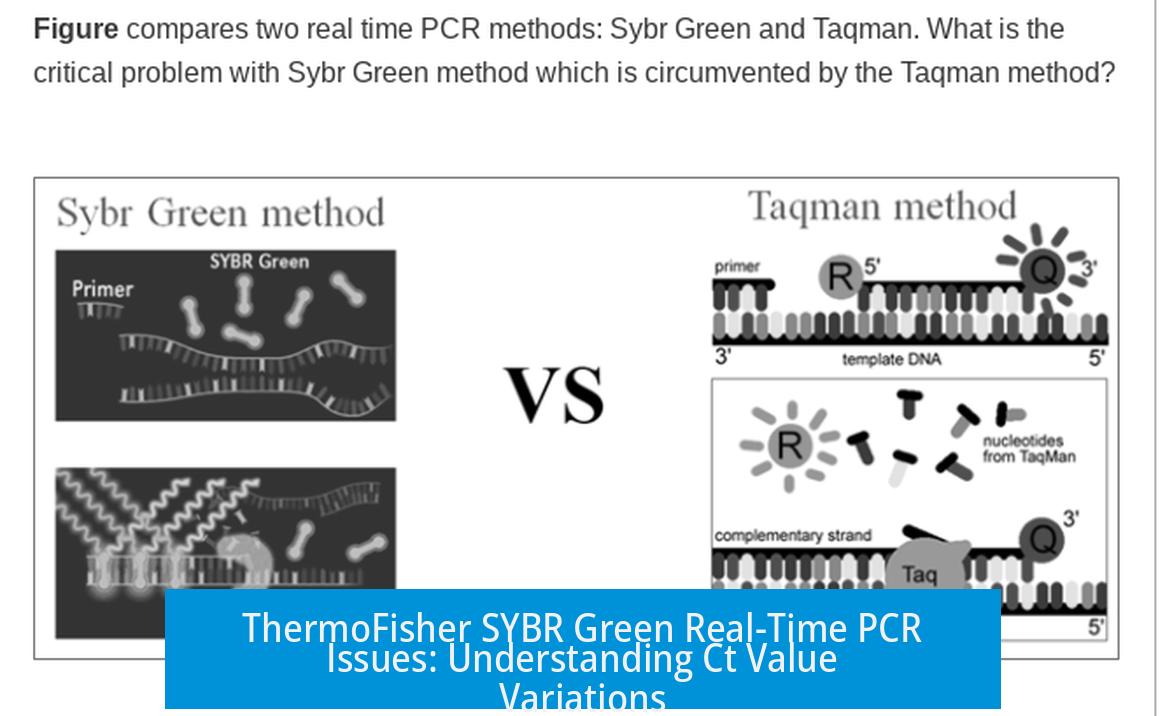
Both SYBR Green and TaqMan are popular chemistries for real-time PCR (qPCR). SYBR Green binds to any double-stranded DNA, including non-specific products such as primer-dimers. TaqMan employs a specific probe with a fluorescent reporter, releasing signal only when the target sequence is amplified.
Why Ct Values Differ Between Assays
- SYBR Green detects all double-stranded DNA, potentially elevating background and altering Ct values.
- TaqMan’s probe-based specificity results in a cleaner signal, usually yielding more precise and lower Ct values for the target.
- Differences in reaction efficiency, primer design, and fluorescence chemistry impact amplification curves and Ct.
Challenges in Direct Ct Comparison
Comparing Ct values across these assays using identical samples can mislead interpretation.
- SYBR Green assays may show higher Ct values due to non-specific fluorescence.
- TaqMan assays typically provide more consistent and reproducible Ct values.
- Protocol variations, enzymes, and buffer compositions further complicate direct comparisons.
Best Practices
For quantitative results, it is advisable to use the same chemistry and assay design throughout a study. When comparing assays:
- Validate both assays independently for efficiency and specificity.
- Avoid direct Ct comparisons; consider relative quantification methods.
- Use melting curve analysis with SYBR Green to confirm specificity.
- Report assay conditions transparently for reproducibility.
Summary of Key Points
- Simplistic Ct value comparisons between SYBR Green and TaqMan assays are unreliable.
- Assay chemistry differences affect fluorescence detection and Ct outcomes.
- Use consistent chemistry within experiments for valid quantitative data.
- Confirm assay specificity and efficiency before interpreting Ct values.
Thermofisher SYBR Green Real-time PCR Problem: Why Your Ct Values Might Be Playing Tricks on You
Ever run the same sample through a Thermofisher SYBR Green real-time PCR and a TaqMan assay, only to scratch your head over the different cycle threshold (Ct) values? You’re not alone. This common issue often causes frustration but understanding it clears up the confusion swiftly.
Simply put, SYBR Green and TaqMan assays produce different Ct values for the same sample. Why? It boils down to the distinct chemistry behind these two methods.
The Chemistry Behind the Ct Curveball
Both SYBR Green and TaqMan are real-time PCR methods used to quantify DNA, but they operate differently. SYBR Green binds indiscriminately to any double-stranded DNA, lighting up as the PCR amplifies. TaqMan, on the other hand, uses a specific probe tagged with a fluorescent dye that only lights up when it binds the exact target sequence.
This key difference means SYBR Green may pick up non-specific products or primer-dimers, creating background fluorescence. This extra noise can influence when the fluorescence crosses the threshold, thus affecting the Ct value.
So, why does this matter?
Interpreting Ct values from SYBR Green and TaqMan assays side-by-side is like comparing apples to oranges. They might be measuring slightly different signals within the same reaction. In practice, a SYBR Green Ct might be slightly lower or higher compared to TaqMan for the same template. This discrepancy can lead to incorrect assumptions about gene expression levels or viral load.
Real Talk: A Practical Example
Imagine a researcher testing viral RNA in patient samples using both methods. The SYBR Green assay shows a Ct of 28, but TaqMan gives 30. Should they trust the lower Ct indicating more viral RNA? Not necessarily. The SYBR Green assay’s lower Ct might result from non-specific binding combined with efficient amplification of minor byproducts.
So, if you’re comparing data from these assays, beware of trusting the numbers blindly. Without understanding this distinction, you might infer higher viral loads or gene expression where none exist.
Tips to Navigate SYBR Green vs. TaqMan Ct Differences
- Run standard curves independently for each assay. This helps normalize the efficiency differences and sets a baseline for comparison.
- Check melt curves for SYBR Green assays. These confirm product specificity by distinguishing target amplicons from primer-dimers or non-specific products.
- Avoid directly comparing Ct values. Instead, focus on relative changes within the same assay type—say, a fold change in SYBR Green alone or TaqMan alone.
- Validate your results with gel electrophoresis. This classic technique confirms the presence of the right amplicon, especially for SYBR Green, which lacks probe specificity.
- Consider assay design carefully. Proper primer design minimizes off-target amplification and reduces Ct value confusion.
Is There a Winner? SYBR Green or TaqMan?
It depends on your experiment’s needs. SYBR Green assays are cost-effective and straightforward for simple targets. But TaqMan’s specificity makes it ideal for detecting low abundance targets or distinguishing between closely related sequences.
Thermo Fisher’s platforms make both methods accessible, but the troubleshooting dance is real. The key takeaway? Don’t compare Ct values from SYBR Green and TaqMan like they’re twins. They’re more like cousins, related but different enough to cause a family reunion headache.
Final Thoughts: Embracing the Quirks for Better Science
Understanding why Thermo Fisher SYBR Green real-time PCR assays yield different Ct values from TaqMan assays is crucial. It prevents data misinterpretation, saves time, and leads to more accurate conclusions.
Besides this, it encourages researchers to be cautious, thorough, and smart when analyzing real-time PCR data, especially in applications demanding precision, from gene expression studies to clinical diagnostics.
Next time you face differing Ct values across these assays, remember: chemistry and specificity dictate the rules, not just your sample’s content. Embrace the differences, apply good practices, and you’ll turn confusion into clarity.
Got a quirky SYBR Green vs. TaqMan story? Share it below—we’ve all been there!
Why do Ct values differ between ThermoFisher SYBR Green and TaqMan assays?
SYBR Green binds to any double-stranded DNA, which can include non-specific products. TaqMan uses a specific probe, leading to more precise detection. This difference can cause variation in Ct values for the same sample.
Can I directly compare Ct values from SYBR Green and TaqMan assays?
Direct comparison is not recommended. The chemistry and detection methods differ, affecting Ct numbers. Always interpret results within the context of each assay’s characteristics.
What causes SYBR Green assays to show higher Ct values sometimes?
Non-specific amplification or primer-dimers can reduce fluorescence efficiency, causing delayed Ct detection. Proper primer design and melt curve analysis help identify these issues.
How to troubleshoot inconsistent Ct values in SYBR Green real-time PCR?
- Check for primer-dimers with melt curve analysis.
- Optimize primer concentrations.
- Ensure consistent reaction setup.
- Use fresh reagents and templates.
Does the choice between SYBR Green and TaqMan affect data reliability?
TaqMan assays tend to provide higher specificity and reproducibility. SYBR Green is cost-effective but requires careful validation to ensure accuracy.


Leave a Comment