What Do Computational Chemists Use to Draw Potential Energy Diagrams?
Computational chemists commonly use Python with Matplotlib, specialized libraries like PyEnergyDiagrams, Excel combined with PRISM, and LaTeX’s TikZ for drawing potential energy diagrams, while ChemDraw is less favored due to its quantitative limitations.
Limitations of ChemDraw
ChemDraw is popular for chemical structures but falls short for potential energy diagrams. It cannot generate quantitatively accurate graphs or scale energy values precisely. This restricts its use when numerical correctness is crucial.
Excel and PRISM for Data and Visualization
Historically, many have used Excel to calculate and organize energy values. These are then imported into PRISM to plot the data with polished chart aesthetics. This method allows separation of data handling and visualization.
Python and Matplotlib: Flexibility and Automation
Python paired with Matplotlib offers strong customization. Users can automate naming schemes, ensure precise energy scaling, and tailor diagrams exactly to their needs. Many chemists prefer Python due to its programming flexibility and integration with scientific workflows.
Specialized Libraries: PyEnergyDiagrams
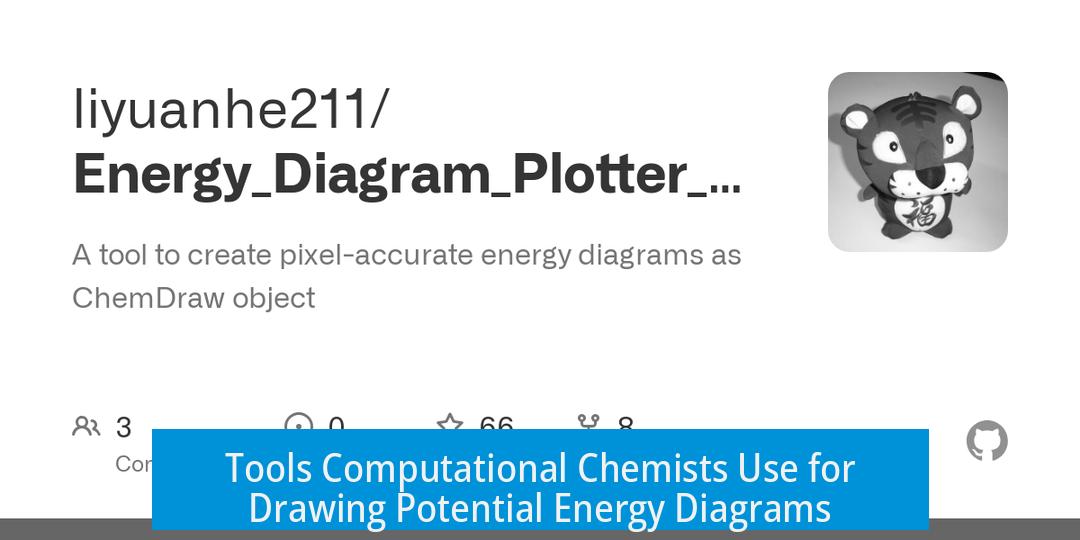
PyEnergyDiagrams is a dedicated Python library designed for creating potential energy diagrams. It simplifies plotting and supports automation. The package is open-source and maintained on GitHub, making it accessible for users familiar with Python.
TikZ in LaTeX for Publishing Quality
Those working with LaTeX often use the TikZ package. TikZ produces publication-quality diagrams and integrates smoothly with scientific documents. It requires learning its syntax but offers precise control over the visual elements.
User Preferences and Features
- Users select tools based on familiarity and project requirements.
- Python’s Matplotlib is favored for combining automation with visualization.
- Embedding images within diagrams is a requested feature; Matplotlib supports this with some programming effort.
Summary of Tools for Potential Energy Diagrams
| Tool | Strengths | Limitations |
|---|---|---|
| ChemDraw | Widely known; easy for chemical structures | Not quantitatively accurate for energy diagrams |
| Excel + PRISM | Data handling + polished plots | Two-step process; less flexible automation |
| Python + Matplotlib | Customizable, automatable, precise scaling | Requires programming skills |
| PyEnergyDiagrams | Specialized for energy diagrams; open-source | Python knowledge needed |
| TikZ (LaTeX) | High-quality output; LaTeX integration | Steeper learning curve |
Key Takeaways
- ChemDraw is common but not reliable for quantitative plots.
- Excel + PRISM separates data and visualization effectively.
- Python with Matplotlib offers the highest flexibility and automation.
- PyEnergyDiagrams supports specialized, streamlined creation.
- TikZ excels in academic publication contexts.
What tools do computational chemists commonly use to draw potential energy diagrams?
ChemDraw, Excel with PRISM, Python with Matplotlib, PyEnergyDiagrams, and TikZ are common tools. ChemDraw is popular but not quantitative. Others offer more control and accuracy.
Why is ChemDraw not ideal for potential energy diagrams?
ChemDraw lacks quantitative accuracy for energy values. It mainly creates visual sketches but does not handle precise calculations or customized plots well.
How can Python and Matplotlib help in drawing energy diagrams?
Python with Matplotlib allows customization in naming and automates plotting. It supports detailed control over the diagram and is flexible for coding custom features.
What is PyEnergyDiagrams, and why might I use it?
PyEnergyDiagrams is a Python library designed specifically for energy diagrams. It simplifies the creation process if you prefer coding, making diagrams easier to generate and update.
Can I add images to potential energy diagrams when using Python plotting tools?
Yes, tools like Matplotlib support adding images to plots through code. This helps include molecular structures or reaction schemes directly in the diagrams.
Is TikZ suitable for creating potential energy diagrams?
TikZ is great if you use LaTeX. It allows precise and professional diagramming, perfect for publication-ready figures within LaTeX documents.
Leave a Comment