Understanding Freezing-Point Depression and Boiling-Point Elevation Diagrams
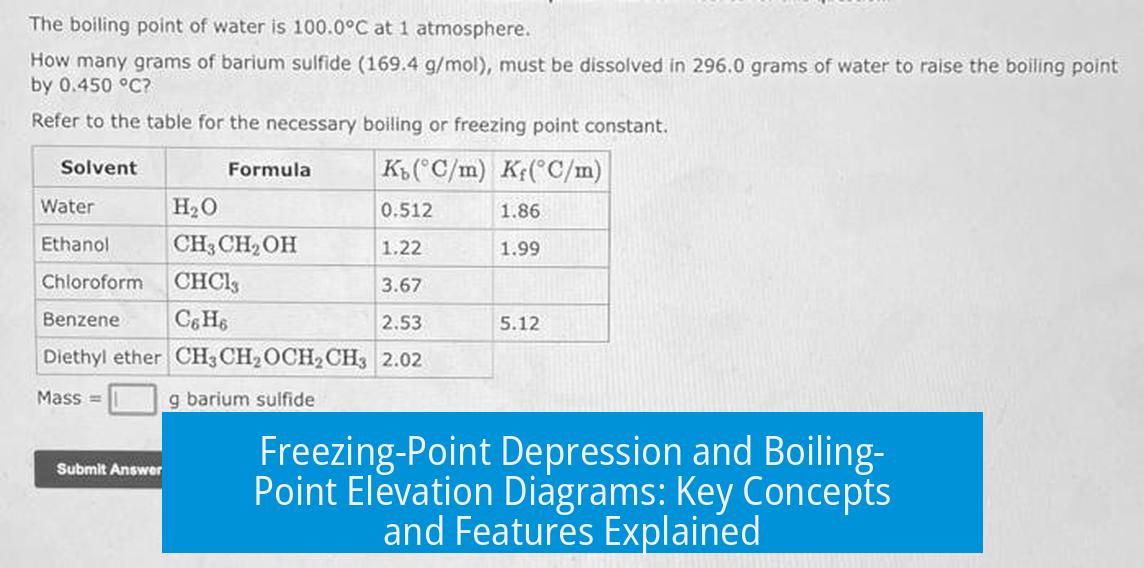
Freezing-point depression and boiling-point elevation diagrams depict how adding a solute to a solvent lowers the freezing point and raises the boiling point of the mixture compared to the pure solvent. These diagrams illustrate phase transitions and equilibrium between solid, liquid, and gas phases in solutions.
Complexity of Phase Behavior in Solutions
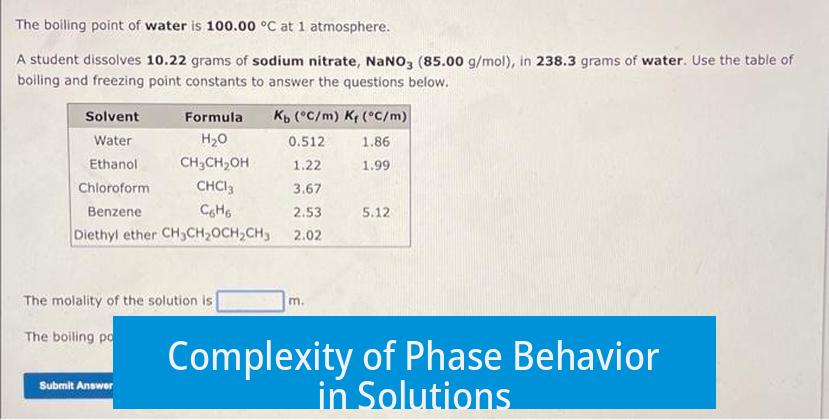
The phase behavior in solutions is complex, influenced by solubility and component volatility. During distillation, both solvent and solute evaporate but at different rates, producing distinct compositions in liquid and vapor phases. Freezing follows a similar pattern where phase compositions change dynamically.
Separation Based on Phase Transition Temperatures
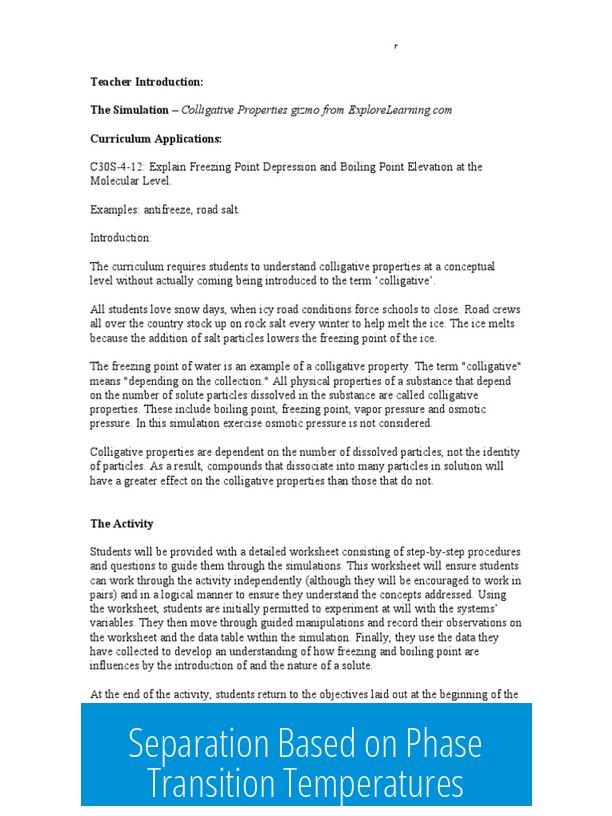
When solvent and solute differ greatly in phase transition temperatures, near-pure separation can occur through freezing. For instance, water freezes at 0 °C, while some solutes freeze near -120 °C. Cooling such mixtures solidifies the solvent almost exclusively, facilitating effective purification.
Role of Phase Diagrams: Eutectics and Azeotropes
To understand freezing-point depression and boiling-point elevation fully, it is essential to study binary phase diagrams, eutectic points, and azeotropes. These concepts explain mixtures with unique melting or boiling behaviors due to specific interactions between components.
Idealized Phase Diagram Features
In idealized diagrams, the solute does not incorporate into the solid phase (like ice) nor vaporize significantly. Consequently, only the liquid phase composition changes. This modifies the equilibrium temperatures:
- Freezing point shifts lower due to solute presence.
- Boiling point shifts higher because solute reduces vapor pressure.
The overall phase diagram shape remains constant, reflecting the fundamental physical states but at altered equilibrium temperatures.
Qualitative Approximation by Vapor Pressure Changes
The depression in freezing point and elevation in boiling point arises from vapor pressure changes induced by the solute. Lower vapor pressure reduces solvent evaporation, leading to elevated boiling points. Meanwhile, solute presence disrupts crystallization, lowering the freezing point. These effects follow Raoult’s law qualitatively but are more complex in real systems.
Key Takeaways
- Freezing-point depression and boiling-point elevation diagrams show phase changes in solutions influenced by solute presence.
- Large differences in freezing points between solvent and solute enable nearly pure phase separation by freezing.
- Understanding binary phase diagrams, eutectics, and azeotropes is crucial for interpreting solution phase behavior.
- Idealized diagrams assume solutes do not enter solid or vapor phases, changing only liquid composition.
- Phase transition temperature shifts result from altered vapor pressure and solubility effects.
Understanding the Freezing-Point Depression and Boiling-Point Elevation Diagram: A Deep Dive
What exactly is freezing-point depression and boiling-point elevation, and how can a diagram help you make sense of these phenomena? These effects reveal how adding a solute alters the phase changes of a solvent—like water—shifting the temperatures at which it freezes or boils. A well-crafted diagram provides visual insight into this interplay, guiding everything from industrial distillation to your kitchen experiments. Let’s unearth the story behind these temperature shifts, their phase diagrams, and why things are more complex than they appear at first glance.
First off, no phase change discussion is simple, especially in solutions. The behavior of such mixtures defies straightforward rules. Why? It boils down to solubility and the interplay between the solvent and solute during phase transitions. Imagine evaporating a salty water solution. Both water (the solvent) and salt (the solute) respond differently to heat, evaporating at different rates. This uneven evaporation changes the composition of both the liquid and vapor phases, making the phase behavior complex. The same principle sneaks into freezing processes too. Because solutes like salt don’t always freeze at the same temperature as the solvent, their presence tweaks when and how the solvent solidifies.
Let’s bring this to life with an example closer to your freezer. Pure water freezes at 0 °C. Now, say you dissolve a salt in it. Salt’s freezing point plunges to around -120 °C, an enormous gap. This sharp difference means that if you simply cool the mixture, water will freeze out first, while salt remains dissolved in the liquid phase. It’s like a temperature battle royale where the solvent and solute take opposing sides. The upshot? You can separate both species neatly by freezing. This phenomenon underpins real-world techniques, such as freeze distillation, allowing almost pure phases to be isolated just by controlling temperature.
Now, how do scientists and engineers visualize these tricky interactions? Enter phase diagrams. These aren’t just geeky charts but powerful tools displaying phase behavior across different temperatures and compositions. To grasp freezing-point depression and boiling-point elevation, you want to explore specific concepts: eutectic points, azeotropes, and binary phase diagrams. A eutectic point marks the composition where the lowest freezing temperature occurs for the mixture, a sweet spot you wouldn’t want to miss in freezing processes. Azeotropes, on the other hand, are stubborn liquid mixtures boiling at constant temperature with fixed vapor compositions—quite the party poopers when you want pure distillates.
When picturing an idealized freezing-point depression and boiling-point elevation diagram, imagine a system where the salt doesn’t sneak into either the ice or gas phases. That is, the salt neither dissolves into the ice (no solid solution forms) nor volatilizes into the gas phase (it stays put, unvolatile). In this setup, only the liquid’s composition shifts, but the overall phase diagram structure stays cozy and familiar. The magic lies in how the temperatures for phase equilibrium move. The freezing point dips lower, and the boiling point creeps higher than pure water at 1 atm pressure—hallmarks of these colligative properties.
Think of this diagram as a temperature roadmap. The x-axis represents composition—the amount of solute versus solvent. The y-axis tracks temperature. Where the curves for solid, liquid, and gas meet marks critical transition points. Notice how the freezing curve drops, illustrating freezing-point depression. Meanwhile, the boiling curve climbs, showcasing boiling-point elevation. Understanding this visualization helps you predict what happens when you dissolve salt, sugar, or any solute in a solvent.
But remember, these diagrams portray a simplified, “idealized” scene. Real-world behavior is messier due to solubility, volatility differences, and molecular interactions. The freezing-point depression and boiling-point elevation aren’t uniform; they fluctuate based on how solute particles change the solvent’s vapor pressure. Lower vapor pressure translates to a lower freezing point and higher boiling point, but the exact shifts vary by solute type and concentration. Thus, the diagram gives a qualitative approximation rather than an exact prediction.
Practical applications abound. For example, road crews sprinkle salt on icy streets because the freezing temperature of water drops in salty solutions—freezing-point depression in action. Similarly, cooking pasta in salted water boils it at a slightly higher temperature, speeding cooking—a neat example of boiling-point elevation. The phase diagrams help chemists fine-tune these effects in industrial settings, such as purifying chemicals or managing refrigeration processes.
Curious about how close lab data matches the idealized diagrams? Many experiments show the salt doesn’t form solid solutions with ice and remains non-volatile, just like the theory predicts. But other solutes behave differently, creating solid mixtures or escaping into vapor. So, these diagrams are starting points, not absolute laws.
Feeling a little overwhelmed? Let’s simplify with some handy takeaways:
- Freezing-point depression lowers the temperature at which a solvent solidifies due to the presence of solute particles.
- Boiling-point elevation raises the temperature at which a solvent boils because solute particles reduce the solvent’s vapor pressure.
- The phase diagram visually depicts how these temperature changes depend on solute concentration.
- When solvent and solute have vastly different freezing points, freezing can effectively separate them.
- Idealized diagrams assume no solute in ice or vapor, simplifying interpretation but missing some practical complexities.
Do you think these principles could solve practical problems in your daily or professional life? Maybe you wonder how much salt to add to your driveway or your soup for best effects. Or perhaps you’re intrigued to explore phase diagrams in your chemistry studies or hobby. The finesse lies in reading these diagrams with an understanding that real solutions can behave both predictably and unexpectedly.
Next time you’re cooking, fighting road ice, or tinkering in the lab, you have a new lens. The freezing-point depression and boiling-point elevation diagram is no longer a cryptic chart but a robust map guiding your expectations and actions. And hey, it might even spark a few “aha!” moments about why your salted water refuses to freeze—or why your morning coffee’s taste differs when brewed at altitude.

Leave a Comment