Comprehensive IR Table: Essential Guide for Infrared Spectroscopy
A comprehensive IR table systematically lists the typical infrared absorption frequencies for various functional groups, enabling precise identification of molecular structures in samples.
Purpose and Definition
An IR spectrum table shows characteristic absorption frequencies of functional groups. By comparing these frequencies with observed spectra, analysts deduce the presence or absence of specific groups in organic and inorganic compounds. This helps determine molecular composition and purity.
Components of a Comprehensive IR Table
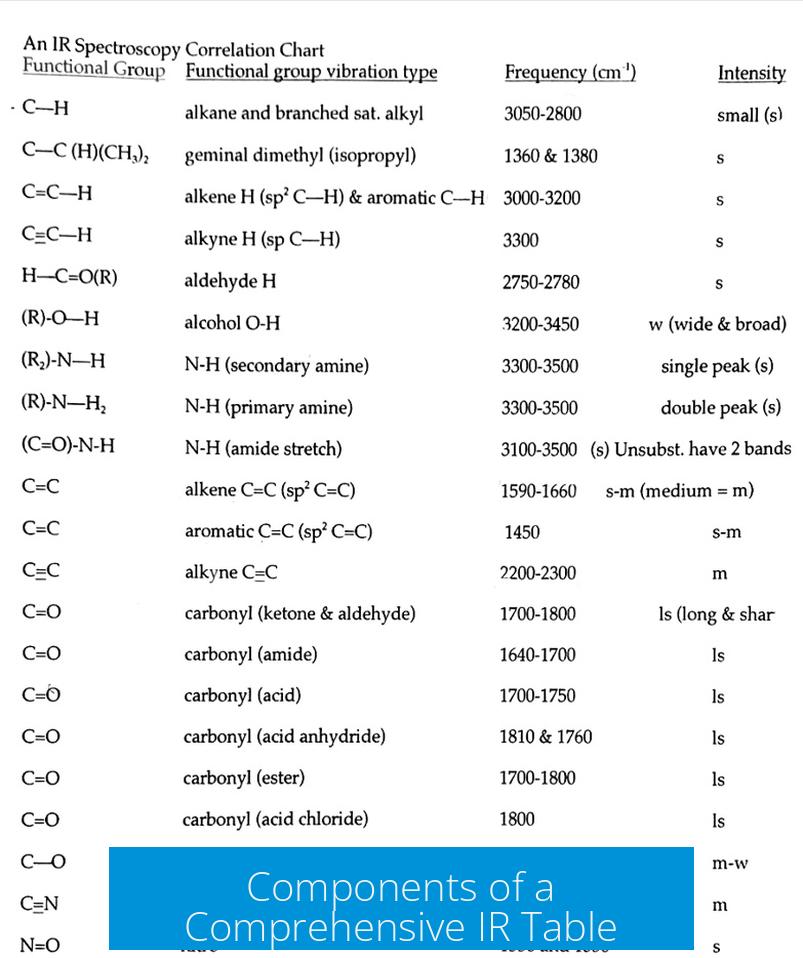
- Absorption Frequency (cm−1): Usually displayed on the x-axis in charts.
- Intensity and Shape: Indicated with terms like medium (m), strong (s), weak (w), broad (b), narrow (n), or sharp (sh).
- Functional Group Assignment: Identifies which bonds or groups correspond to each absorption.
Challenges in Compiling a Comprehensive Table
Many functional groups exhibit multiple vibronic modes, making a fully comprehensive table quite large. Single, concise charts often omit detailed variations. For exhaustive coverage, reference books are necessary.
Recommended Resources
- Structure Determination of Organic Compounds – Offers extensive IR absorption tables with citations. Earlier editions remain useful and widely referenced. A free PDF version is available online through academic sources.
- Spectrometric Identification of Organic Compounds by Silverstein – A fundamental book including well-organized IR tables.
- KNowitall Software – Previously a free database by Biorad containing IR tables, though may now be commercial.
Application in Spectrum Interpretation
IR spectrum charts graphically depict absorption intensities, aiding qualitative analysis. Combined with IR tables, they allow chemists to identify molecular functional groups and assess sample purity effectively.
Access to Free Resources
Free downloadable materials such as FT-IR spectrum tables are available online. These include frequency ranges and vibration details for common functional groups and are practical for teaching and research.
Key Takeaways
- Comprehensive IR tables list absorption frequencies to identify functional groups.
- Complexity arises from multiple vibronic modes per group, requiring detailed references.
- Classic books and updated software provide reliable comprehensive data.
- IR charts complement tables for accurate spectrum interpretation.
- Free PDFs offer accessible resources for common functional groups and absorption traits.
Unlocking the Mystery of a Comprehensive IR Table: Your Ultimate Guide
What exactly is a Comprehensive IR Table? Simply put, it’s a detailed list of IR absorption frequencies for a wide array of functional groups, crucial for chemists when analyzing molecular structures.
Infrared (IR) spectroscopy reveals the “fingerprints” of molecules by showing where bonds absorb energy. But decoding these patterns requires solid reference tools, and that’s where the Comprehensive IR Table sweeps in like a superhero sidekick.
Why Does One Need a Book (Or Two) for a Truly Comprehensive IR Table?
You might be shaking your head, thinking, “Why not just find a neat, one-page table online?” The truth is, it’s complicated.
Each functional group doesn’t just vibrate once. It often has several vibronic modes—multiple types of vibrations happening at different frequencies.
So, a truly comprehensive IR table becomes a sprawling tome, packing tons of detail into dozens (if not hundreds) of pages. A quick Google search only scratches the surface.
For serious work, relying on a book is the golden rule. For instance, an older classic called Structure Determination of Organic Compounds houses extensive IR tables with well-documented absorption frequencies. It’s so revered that many chemists pinch themselves when flipping through its dense pages, although finding the exact edition might feel like a treasure hunt. An earlier edition is enough, and you can find parts of it online—just check the IR section here.
Another gem is Spectrometric Identification of Organic Compounds by Silverstein. This book has been a go-to since the 1960s and stacks up detailed tables alongside practical interpretation tips. It’s like having a seasoned IR spectroscopist whispering in your ear.
Software Might Fill a Gap, But It’s Not a Magic Wand
Once upon a time, software named KnowItAll was the darling of the IR spectroscopy world, blending vast spectral libraries with user-friendly functions. It was even free from Bio-Rad, which surprised many.
Sadly, KnowItAll has since changed hands and likely requires a license or purchase now. But it offers a glimpse into how digital tools can supplement the massive data in those heavyweight books.
The takeaway? Software helps, but it doesn’t replace the depth of classic, peer-reviewed tables found in well-curated books.
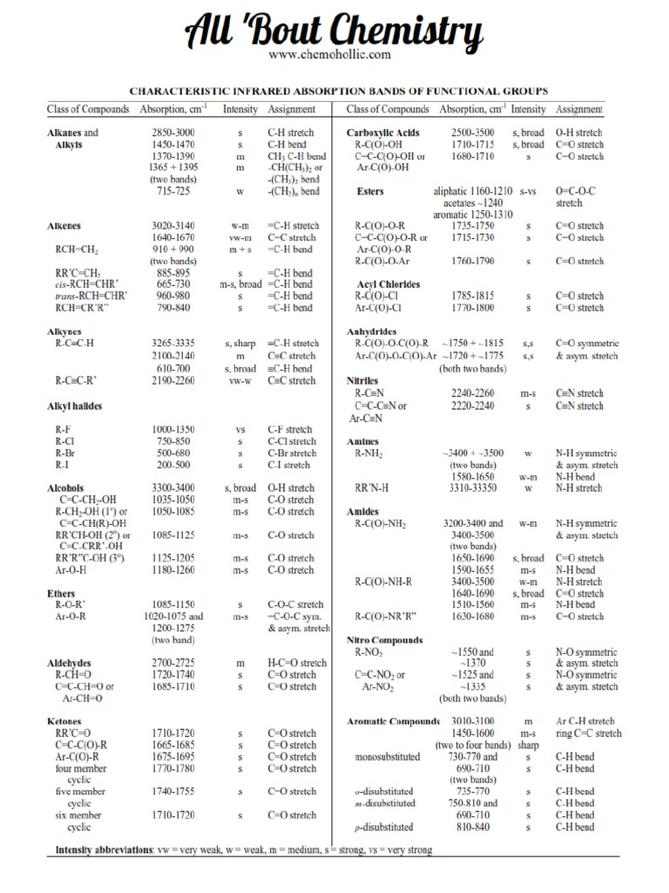
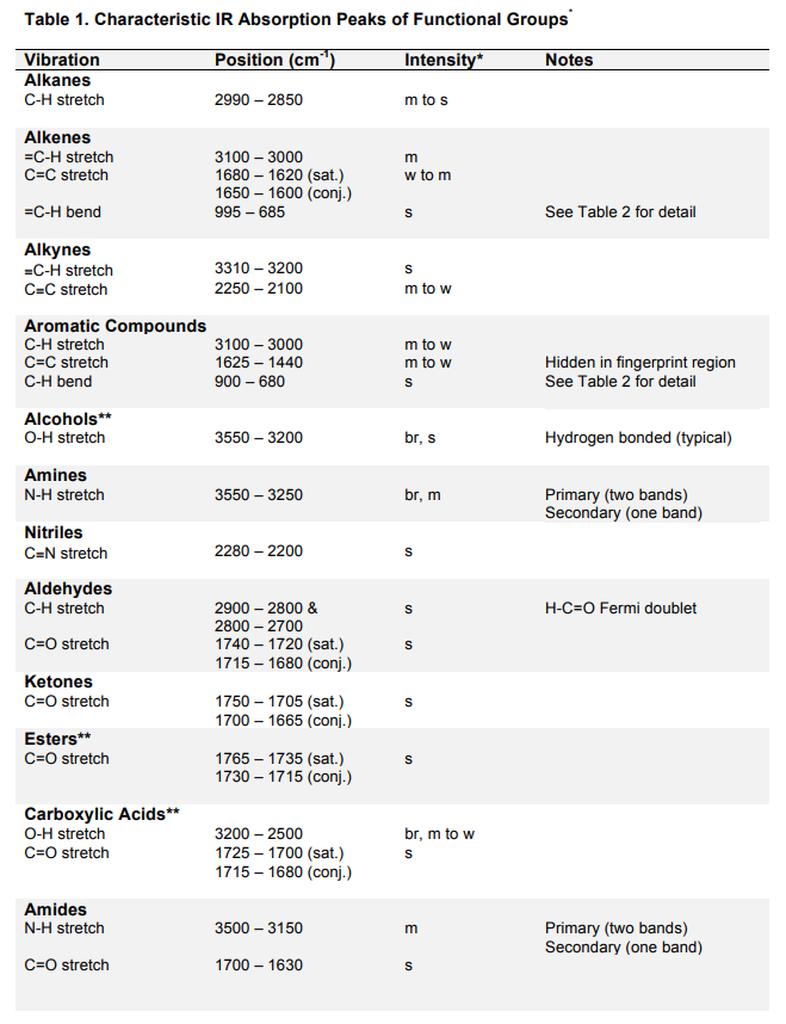
What Does a Comprehensive IR Table Look Like?
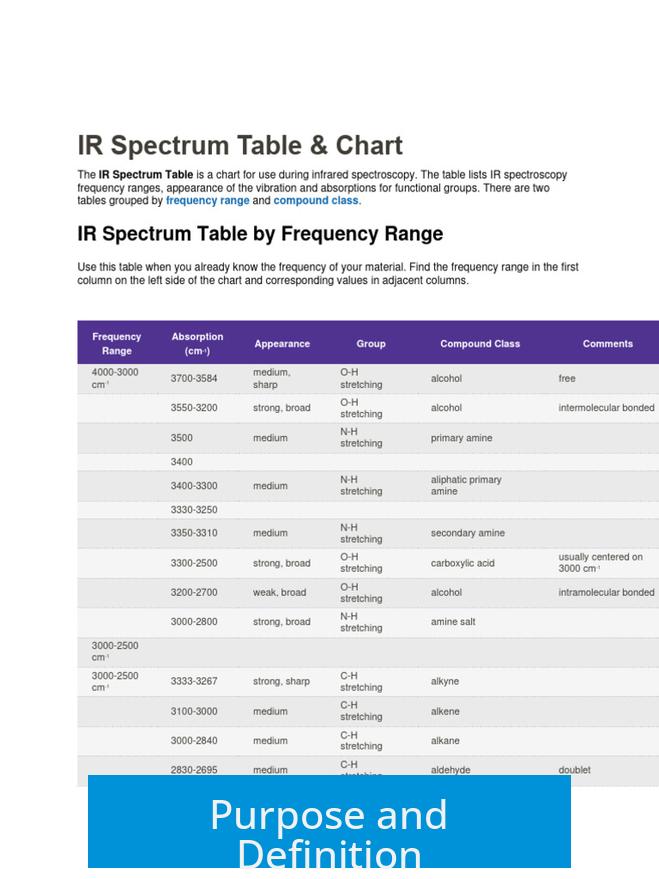
Far from a simple chart, it usually comes as an IR spectrum table or chart:
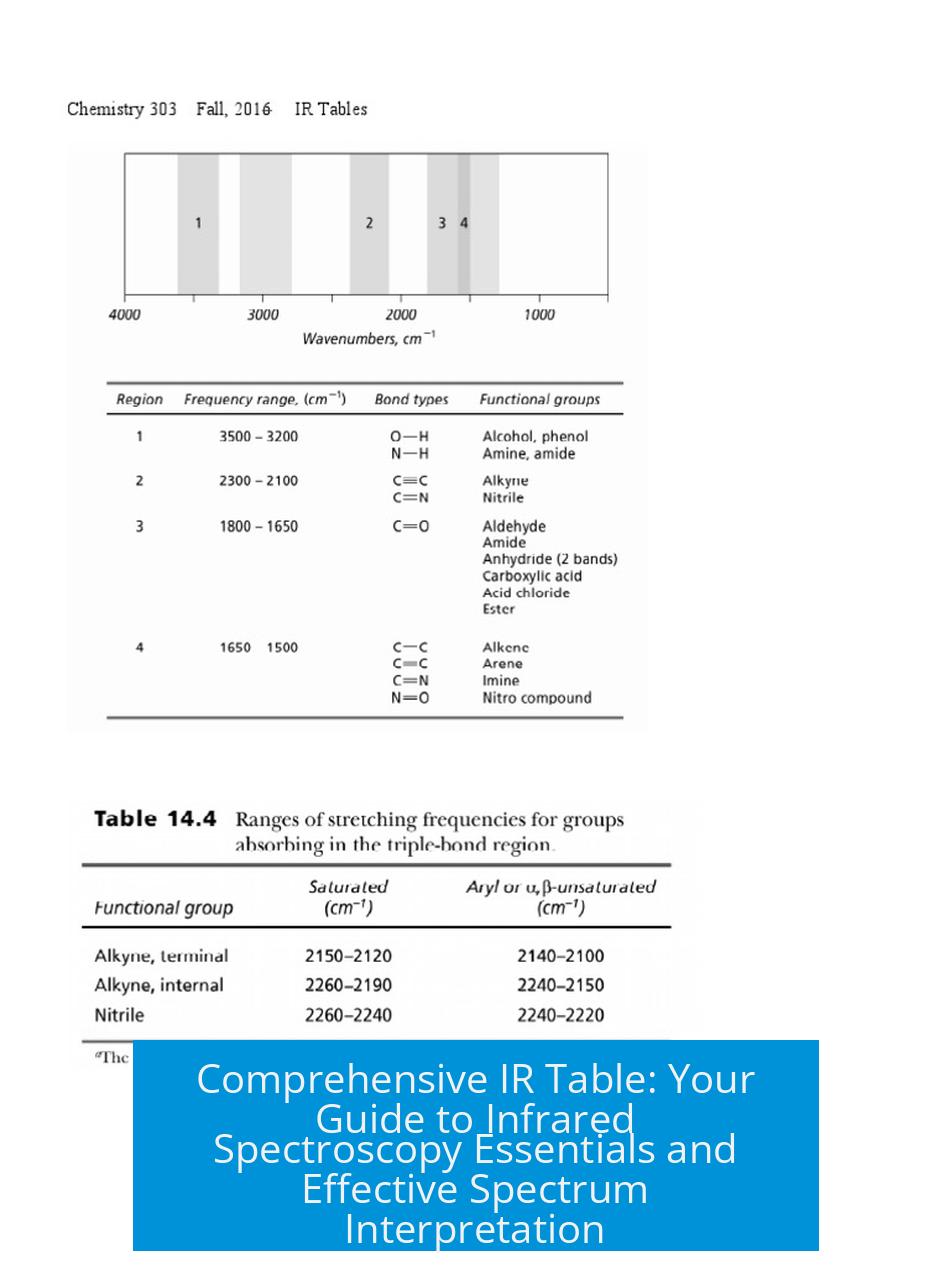
- Frequency ranges (in cm-1) are listed, showing typical absorption peaks.
- Functional groups are mapped to these frequencies, indicating which vibrations correspond to which molecular fragments.
- Intensity and shape of absorption (strong, medium, weak; broad or sharp) help describe the data further.
For example, a carbonyl group (C=O) shows a strong, sharp absorption roughly between 1650–1750 cm-1. But knowing the exact frequency can help distinguish types like ketones versus esters.
These tables act as roadmaps to navigating an IR spectrum, guiding interpretations with precision rather than guesswork.
Why Is It So Hard to Find a Concise Yet Comprehensive Table?
Imagine cramming the entire Beatles discography onto a single vinyl. You simply can’t fit everything without losing richness. Similarly, IR tables require detail to be truly useful.
Many functional groups display multiple vibrational modes. Listing every nuance means pages of data. Attempting to condense this risks losing critical information, leading to misidentifications.
It’s a balancing act between usability and thoroughness. Most quick-reference charts simplify or focus on the most common peaks, which might suffice for routine labs but not for deeper research.
How to Use a Comprehensive IR Table Effectively in Spectrum Interpretation
Here’s the real magic: pairing the table with an IR spectrum chart.
The chart has frequency on the x-axis and absorption intensity on the y-axis. When you overlay your sample’s spectrum on this framework, matching peaks to known functional groups becomes an exciting detective game.
- Spot a peak around 3300 cm-1? Could signal O–H or N–H stretch.
- Strong absorption near 2200 cm-1? Possibly a C≡C or C≡N triple bond.
Use the table’s detail on peak shape and intensity to narrow down possibilities. This approach helps confirm molecular identity, assess sample purity, or detect impurities.
Where to Get Your Hands on a Free FT-IR Spectrum Table Today?
If you’re hunting for something free and accessible, there are PDFs floating around online. One notable example is the FT-IR Spectrum Table—available as a PDF or text file—that outlines frequency ranges and typical vibrational behaviors.
Though condensed compared to book editions, such resources offer a solid starting point especially for students or quick reference.
Wrapping It Up: Why Invest in a Comprehensive IR Table?
A detailed IR table is no luxury—it’s the backbone of confident spectral interpretation. It transforms complex vibration patterns into meaningful data, aids in identifying functional groups with precision, and safeguards against error.
Sure, those tables can be hefty and not always easy to access on a whim. But investing time in trusted books or reputable digital tools pays off.
Have you ever misread an IR spectrum due to incomplete data? What’s your go-to resource when clarity calls? Feel free to share your stories or ask questions!
What is a Comprehensive IR Table used for?
A comprehensive IR table lists typical IR absorption frequencies for various functional groups. It helps identify which groups are present in a sample by comparing observed absorption frequencies to the table.
Why is it hard to find a concise, comprehensive IR table?
Many functional groups have multiple vibronic modes, making a complete table very long. This complexity means most comprehensive tables are found in detailed books, not simple charts.
Are there recommended books for detailed IR tables?
Yes, the *Structure Determination of Organic Compounds* and Silverstein’s *Spectrometric Identification of Organic Compounds* are well-known. Older editions often contain extensive IR absorption tables.
Can software help with IR tables?
Previously, KnowItAll software offered extensive IR data for free. Now it’s likely paid, but it remains a useful tool to explore for IR spectral information.
What is shown in an IR spectrum chart alongside the IR table?
The chart plots absorption frequency on the x-axis and absorption intensity on the y-axis. It visually supports the table by showing the actual spectrum of a compound for interpretation.
Leave a Comment