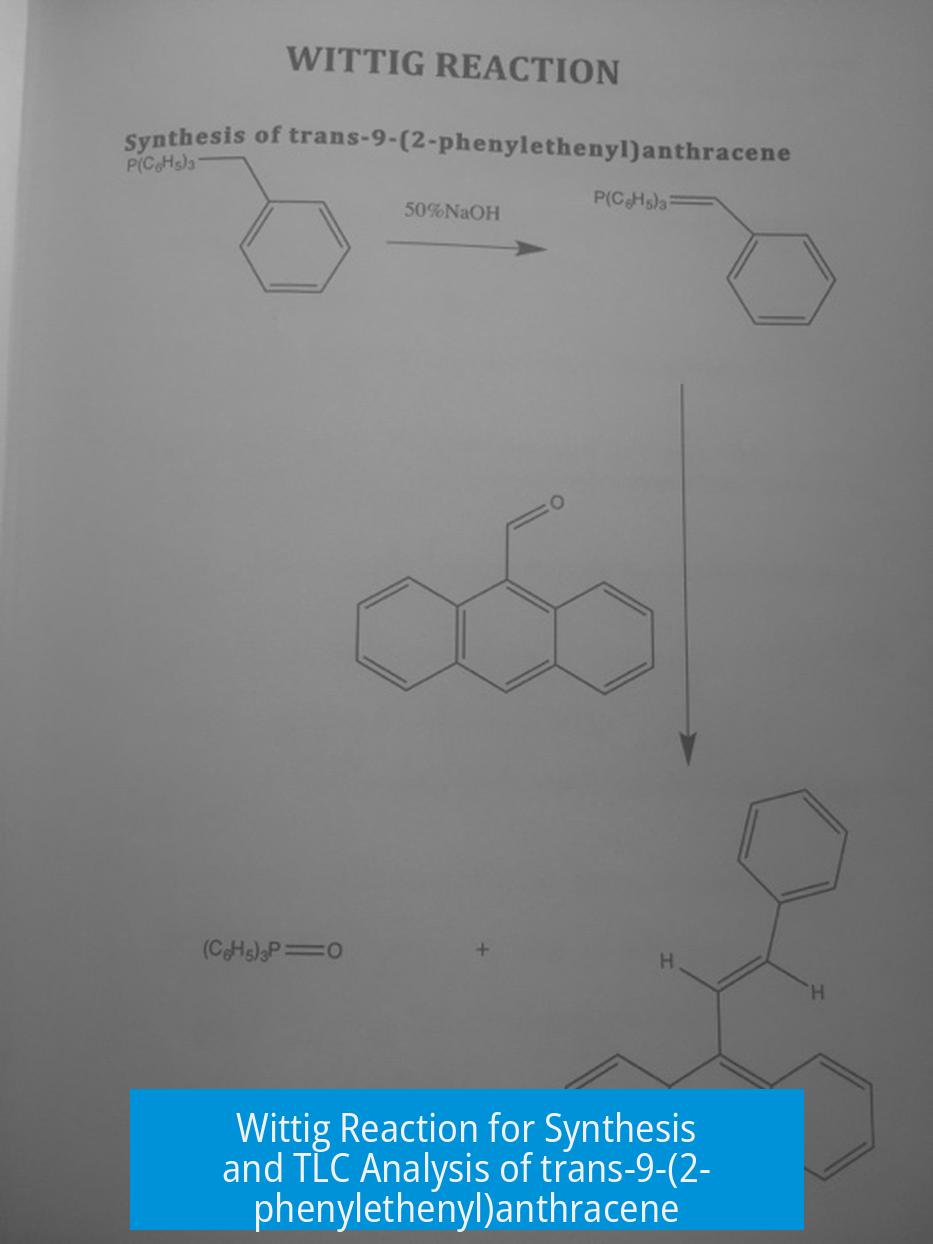
Wittig Reaction: Synthesis of trans-9-(2-phenylethenyl)anthracene and TLC Analysis
The Wittig reaction efficiently synthesizes trans-9-(2-phenylethenyl)anthracene by reacting 9-anthraldehyde with a phosphonium ylide, and TLC analysis helps monitor the reaction progress, identify impurities, and assess product purity. Proper interpretation of TLC spots, solvent choice, sample preparation, and understanding compound behavior on silica gel are critical for accurate analysis.
Overview of the Wittig Reaction for trans-9-(2-phenylethenyl)anthracene
The Wittig reaction couples an aldehyde or ketone with a phosphonium ylide to form alkenes. For synthesizing trans-9-(2-phenylethenyl)anthracene, 9-anthraldehyde is reacted with a styryl phosphonium ylide. The reaction generally proceeds via a [2+2] cycloaddition intermediate, ultimately yielding the desired stilbene-type structure at the 9-position of anthracene.
The process is air-sensitive and challenging because phosphonium ylides are moisture and oxygen-sensitive, potentially lowering yields if handled improperly. Yields of about 55% are typical in undergraduate settings, but unusually high yields (close to 96%) may indicate measurement errors or incomplete sample characterization.
TLC Analysis: Identifying Starting Material, Product, and Impurities
Identifying Starting Material and Oxidation Products
- The spot observed near the baseline in TLC generally corresponds to 9-anthraldehyde, the starting aldehyde.
- A second spot around Rf 0.4 is often an impurity, possibly a carboxylic acid formed by slow oxidation of the aldehyde during storage.
- Aldehydes can oxidize, but 9-anthraldehyde is a solid, which slows oxidation rate, reducing the intensity of acidic impurities.
- Staining the TLC plate with 2,4-dinitrophenylhydrazine (2,4-DNPH) can confirm the aldehyde’s identity by forming a hydrazone derivative, which appears as a colored spot.
Behavior of Reaction Byproducts and Product on TLC
- Triphenylphosphine oxide (Ph3P=O), a byproduct of the Wittig reaction, usually remains near the baseline due to strong affinity to silica gel.
- Ph3P=O tends to streak on the plate, especially if samples are overloaded, complicating spot interpretation.
- The product, trans-9-(2-phenylethenyl)anthracene, typically shows a higher Rf spot reflecting lower affinity for the stationary phase compared to polar impurities.
Understanding TLC Limitations and UV Detection
TLC analysis is qualitative; it cannot accurately quantify compounds. Compounds with strong UV absorption can give disproportionately intense spots, which may mislead interpretations.
For example, a small amount (0.5%) of a strong UV-absorbing impurity might appear as a darker spot than the main product at 99.5% concentration if the product absorbs UV weakly.
Hence, relying solely on UV spot intensity can misrepresent actual compound proportions.
Impact of Compound Structure and Solvent Choice
Polycyclic Aromatic Compound Behavior on Silica
- Polycyclic aromatics like trans-9-(2-phenylethenyl)anthracene have complex interactions with silica gel. Their affinity is affected by both polarity and kinetic solubility.
- Smaller molecules may elute more easily, but large, planar molecules can exhibit delayed elution or streaking due to low kinetic solubility.
- These molecules often require more polar eluents (e.g., ethyl acetate instead of dichloromethane) for better migration.
- Remember, Rf reflects relative affinity between mobile and stationary phases, not simply polarity.
Solvent Effects and Sample Preparation
- Using relatively non-volatile or polar solvents (like 1-propanol) for spotting can affect migration by altering the mobile phase composition during development, causing spots to shift higher than expected.
- Allowing spots to dry thoroughly before development mitigates solvent interference and improves spot definition.
- Overloading TLC plates with concentrated samples leads to streaking, reducing resolution and complicating spot interpretation.
Using polar eluents such as ethyl acetate improves separation of polar impurities and helps move the product further up the plate, enhancing resolution.
Analytical Best Practices and Controls
- Run co-spot samples (spotting starting material and product alongside reaction samples) to ensure correct identification of spots.
- Avoid cross-contamination by using fresh spotting tools for each sample.
- Use plates without physical defects, such as chipped edges, to prevent spot displacement.
- Use dilute sample solutions to avoid overloading and streaking.
- Consider staining with selective reagents (like 2,4-DNPH for aldehydes) for substance identification.
Assessing Reaction Completion and Product Purity
Wittig reactions can leave starting materials unreacted or produce side-products. TLC helps assess reaction completeness by comparing spot intensity at baseline (starting material) vs. product spot.
Filtrates may contain product mixed with residual byproducts like triphenylphosphine oxide. TLC spots for such mixtures may show distorted Rf values and streaking.
Reported yields above typical literature values in undergraduate labs can result from:
- Measurement inaccuracies (e.g., errors in weighing samples due to unreliable scales).
- Incomplete removal of impurities inflating sample mass.
- Lack of verification by additional analytical methods (melting point alone may be inconclusive).
Summary of Key Points
- TLC spots near baseline correspond to starting 9-anthraldehyde; spot at ~0.4 Rf often signifies oxidized impurities.
- Triphenylphosphine oxide remains close to baseline, causing streaking if overloading occurs.
- UV absorption affects spot intensity; strong UV absorbers can mislead purity assessment.
- Polycyclic aromatics need polar eluents; solvent choice and drying affect TLC quality.
- Co-spots and proper sample preparation are essential for accurate identification on TLC.
- Wittig reactions are air-sensitive, often reaching ~55% yield; higher yields warrant scrutiny of measurement and purification.
- Improvement suggestions: better drying, dilute samples, co-spots, use of polar eluents (ethyl acetate), and plate quality checks.
What indicates the presence of starting material and impurities on TLC for this Wittig reaction?
The spot near the baseline is likely the starting aldehyde. A faint spot at Rf 0.4 could be an impurity. Aldehydes may contain carboxylic acid impurities from slow oxidation, but this is minimal for solids.
How does the solvent used for spotting affect TLC results in this synthesis?
If the spotting solvent, like n-propanol, doesn’t fully evaporate, it alters the mobile phase. This pushes spots higher on the plate, causing inaccurate Rf values and streaking, especially with polar solvents.
Why might the product and byproducts show unexpected Rf values or streaking on TLC?
Triphenylphosphine oxide often remains near the baseline and can cause streaking. Overloaded samples can distort migration. Large polycyclic aromatics may dissolve slowly, affecting elution and spot shape.
Can UV absorption lead to misleading TLC interpretations in this reaction?
Yes. Some impurities absorb UV strongly even at low amounts, appearing as dark spots. The product might be the major component but appear lighter due to weaker UV absorption.
What practices improve TLC analysis accuracy for this synthesis?
Allow spots to dry before developing. Use co-spots as controls. Avoid overloading plates. Select appropriate mobile phases that balance polarity to resolve product and impurities well.


Leave a Comment