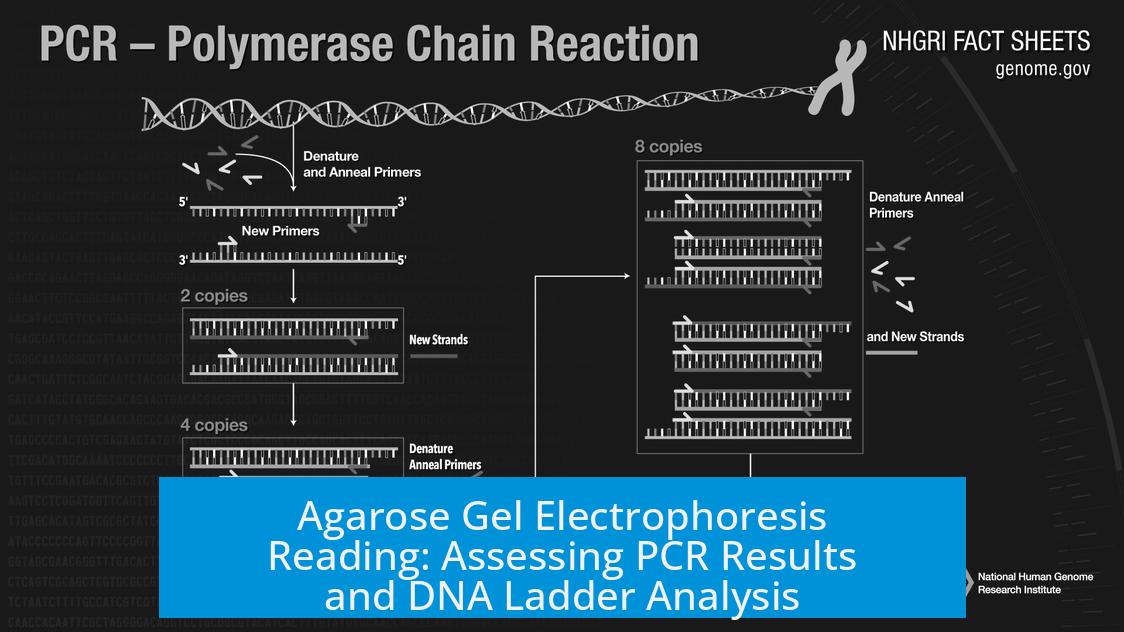
Reading Agarose Gel Electrophoresis for PCR Products
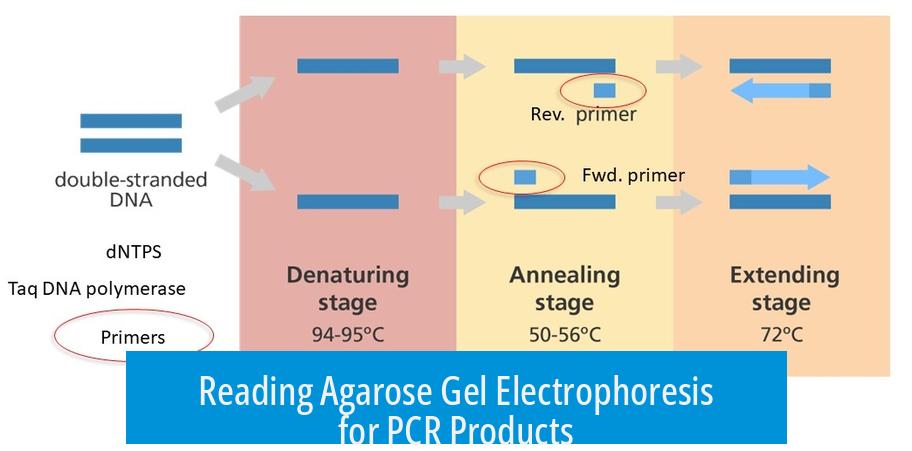
Agarose gel electrophoresis results show DNA fragment sizes by comparing sample bands to a DNA ladder. The ladder serves as a reference, enabling estimation of PCR product size. Proper band resolution allows clear interpretation, confirming if the PCR amplified the expected fragment.
Understanding the DNA Ladder
The DNA ladder is essential for sizing DNA fragments. Each band in the ladder corresponds to a fragment of known length, usually measured in base pairs (bp). Manufacturers provide detailed tables specifying the fragment sizes that match each ladder band. When a sample DNA band aligns with a particular ladder band, one can estimate the fragment length easily.
For example, a common ladder like the 1 kb ladder contains bands at 250 bp, 500 bp, 750 bp, 1000 bp, 1500 bp, and higher lengths. If your sample band migrates alongside the ladder’s 1500 bp band, you can infer your PCR product is about 1500 bp long.
Estimating PCR Product Size
To estimate your PCR product size, compare migration distances between the ladder and your samples. The DNA moves through the gel at a rate inversely proportional to its size; smaller fragments travel farther.
- Measure the distance each ladder band migrates from the well.
- Plot these measured distances against the known ladder band sizes on semi-log graph paper or using software.
- Determine the size of unknown sample bands by comparing their migration against this standard curve.
If lanes 2 and 3 contain the same DNA sample, similar migration patterns and band sizes confirm reproducible PCR amplification. Bands matching the same ladder fragment suggest that the PCR products have consistent size around the expected amplicon length.
Assessing Resolution of the Gel
Resolution in agarose gel electrophoresis refers to how clearly DNA bands can be distinguished. It depends on several factors, including agarose concentration, voltage, running time, and DNA quality.
- Band clarity: Tight, sharp bands without blurring indicate good resolution.
- Band separation: Bands must be spaced adequately with no overlap to differentiate various DNA fragments on the ladder and in samples.
- Absence of smearing: Well-defined single bands are preferred over smeared patterns.
In your gel, clear bands in lanes 2 and 3 suggest good resolution. The DNA ladder shows well-separated bands without overlap, affirming your gel quality. You might extend the run time slightly to better separate closely sized bands, but the current results seem acceptable for analysis.
Interpretation Using the DNA Ladder
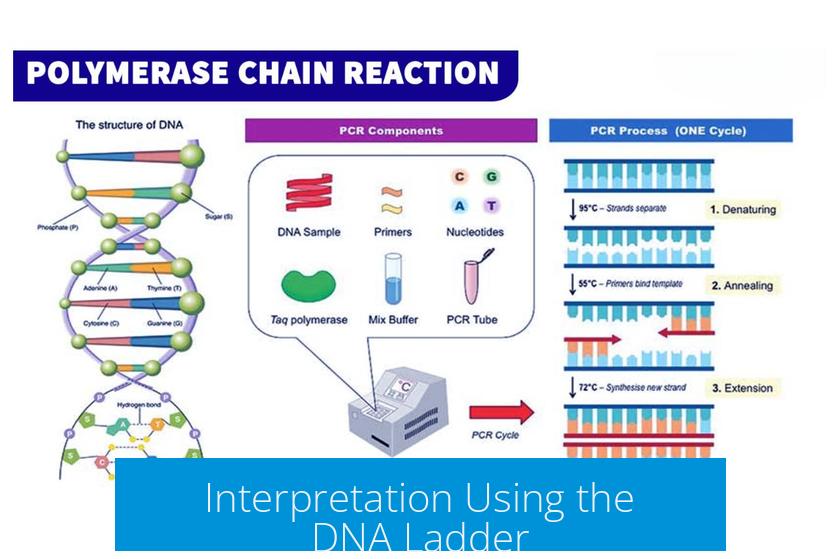
The ladder provides specific size markers that serve as benchmarks. By matching your sample bands to ladder bands, you can conclude:
- Your PCR product size appears consistent with the expected fragment length, e.g., approximately 1500 bp if your ladder’s corresponding band is at 1500 bp.
- Duplicate lanes from the same DNA sample show consistent band patterns, confirming reliable amplification.
- Any unexpected bands or smears indicate possible nonspecific amplification, primer-dimers, or degraded DNA.
Smearing can arise from several factors such as overloading DNA, degraded samples, suboptimal PCR conditions, or incomplete purification. Implementing PCR clean-up or gel purification improves sample quality and enhances band sharpness.
Laboratory Best Practices in Gel Documentation
Labeling and documentation are vital for clarity and reproducibility. Adopting a systematic labeling approach enhances data interpretation. Include the following:
- Ladder band sizes clearly marked, referencing vendor specifications.
- Well numbers and their corresponding sample or control descriptions.
- Direction of DNA migration (from negative to positive electrode).
- Expected amplicon sizes annotated for each sample lane.
- Control lanes clearly identified (positive control, negative/no-template control).
- Loading volumes and electrophoresis conditions recorded.
For your gel, loading 20 μL per well and running at 115 V for 20 minutes is typical. These parameters influence band sharpness and separation.
Summary Table: Key Characteristics and Interpretations
| Aspect | Interpretation |
|---|---|
| DNA Ladder | Reference standards allow estimation of fragment sizes aligned with ladder bands |
| Sample Bands | Consistent size and position in duplicate lanes indicate reproducible PCR amplification |
| Band Resolution | Sharp, separated bands with no overlap confirm good gel quality |
| Smearing | Possible degraded DNA, impurity; consider purification steps before sequencing |
| Gel Conditions | 20 μL loading, 115 V, 20 min typical; can be modified to improve separation |
| Labeling | Essential to track lanes, sample identity, and expected sizes for comprehensive analysis |
Practical Recommendations
- Confirm the exact ladder and its band sizes from the manufacturer’s documentation before analysis.
- Plot migration distance versus band size for precise estimation of unknown fragment lengths.
- Maintain consistent loading volumes to compare lanes accurately.
- If bands appear blurry or smeared, repeat PCR with cleaner template or perform gel purification.
- Document all gel annotations, including ladder sizes, well numbers, and expected amplicon sizes.
Key Takeaways
- The DNA ladder allows estimation of PCR product sizes by matching migration distances.
- Similar band patterns in duplicate lanes indicate consistent amplification of the target fragment.
- Sharp, well-separated bands demonstrate good gel resolution and electrophoresis conditions.
- Smearing can signal contamination or degraded DNA; purification may be necessary.
- Detailed labeling and documentation reinforce data reliability and learning.
What does the DNA ladder tell me about my PCR product size?
The DNA ladder shows known fragment sizes. Compare your bands to ladder bands. This helps estimate your PCR amplicon’s size. If your band matches a ladder fragment, you’ve likely amplified the expected product.
Is the resolution of my gel good enough for analysis?
Check if bands are sharp and separate without smearing or overlap. Tight bands in your sample lanes and clear ladder bands suggest good resolution. Slightly longer running time might improve separation.
How can I use the DNA ladder to determine my sample band size?
Plot migration distance of ladder bands vs. fragment size. Locate your sample band migration on this graph to estimate size. Bands at the same distance as a ladder band indicate similar fragment length.
Why might my PCR bands appear smeared on the gel?
Smearing can result from impurities or incomplete purification. Perform gel or PCR purification before running. This enhances band sharpness and data clarity.
What best practices should I follow when labeling and documenting my gel?
Label ladder fragment sizes, lane numbers, sample types, and expected amplicons. Note DNA migration direction and controls. Clear documentation aids interpretation and reproducibility.

Leave a Comment