How to Approach Solving a Restriction Mapping Problem
Restriction mapping begins by carefully analyzing the plasmid and fragments generated by restriction enzyme digestion. The first step usually involves confirming the known sites and fragment sizes, then deducing new sites introduced by a cloned insert.
Step 1: Understand the Original Plasmid and EcoRI Sites
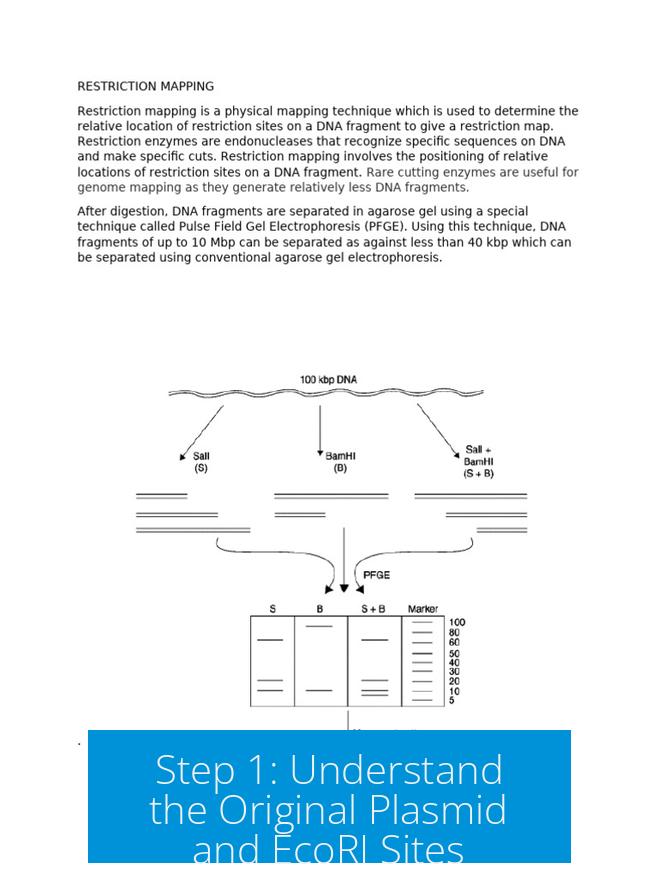
You have a 5 kb plasmid with a single EcoRI site. After cloning a 4.2 kb fragment, digestion with EcoRI yields two fragments: 5 kb (original plasmid) and 4.2 kb (insert), always summing to the total 9.2 kb plasmid size. This confirms the EcoRI site positions and total plasmid length.
Step 2: Analyze PstI Digestion and Infer New Sites
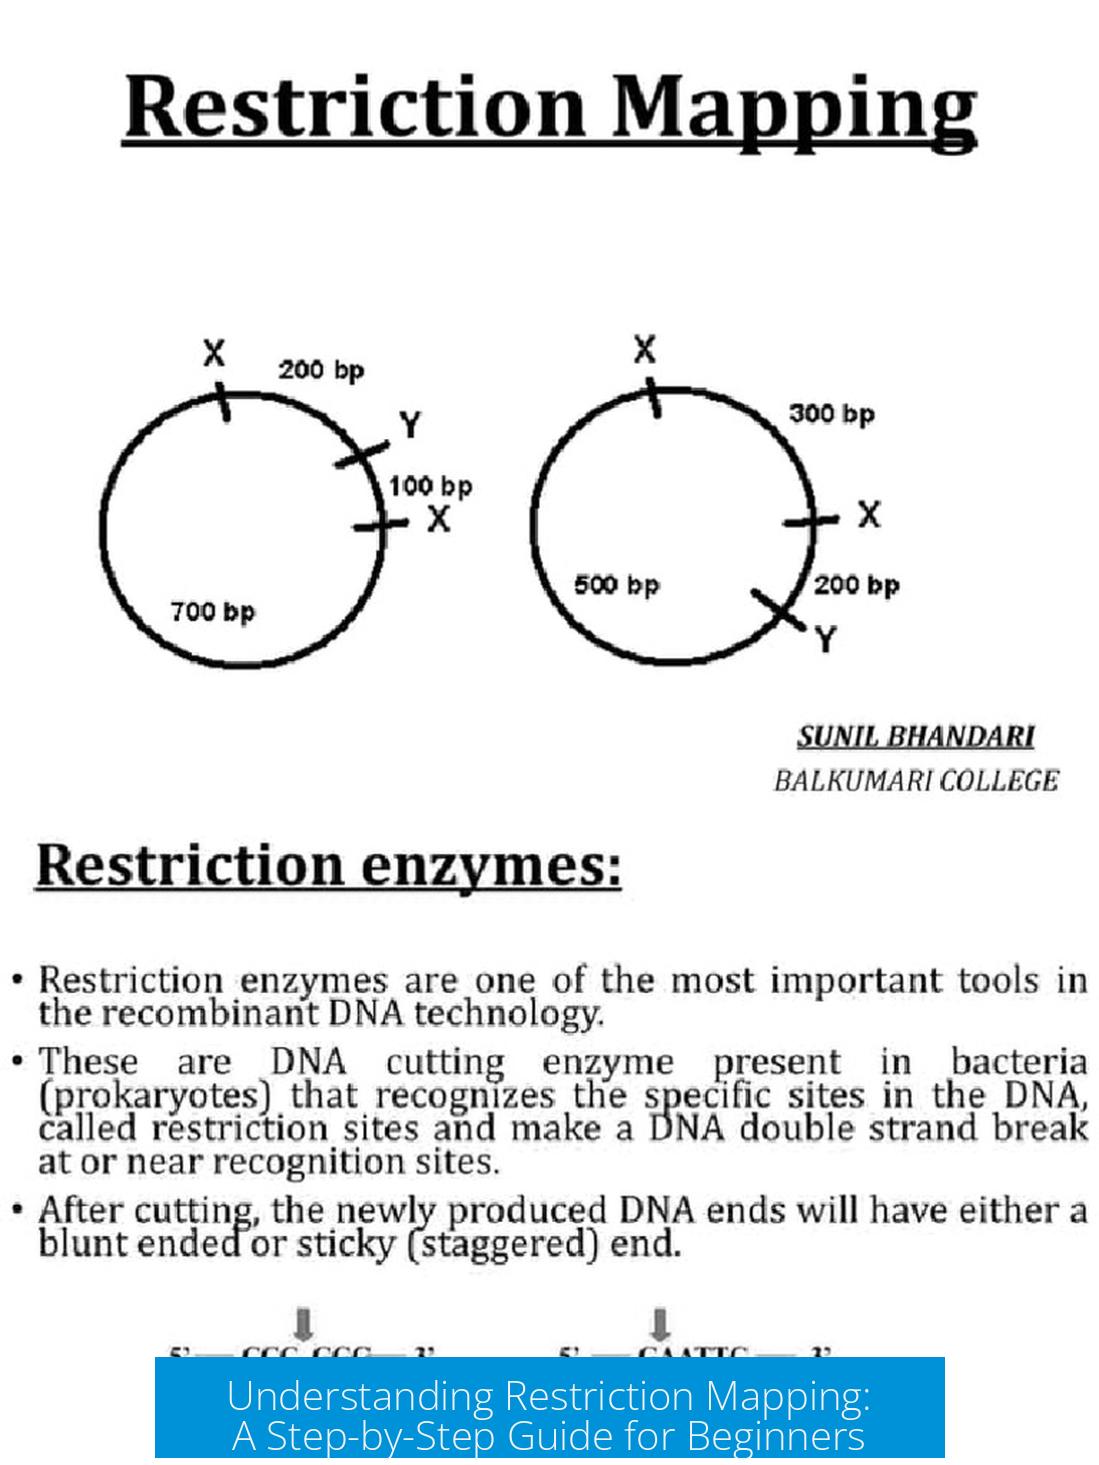
The original plasmid contains one PstI site, located 0.5 kb clockwise from the EcoRI site. Digesting the new plasmid yields three fragments, indicating two extra PstI sites lie in the insert fragment. Fragment sizes are 7.4 kb, 1.1 kb, and 0.7 kb.
Since 7.4 kb fragment includes the 4.5 kb part near the original PstI site (considering orientation), the missing 2.9 kb piece corresponds to the first PstI site in the insert. The remaining small fragments (1.1 kb and 0.7 kb) represent the distances to the second insert PstI site.
Step 3: Drawing the Map and Locating Sites
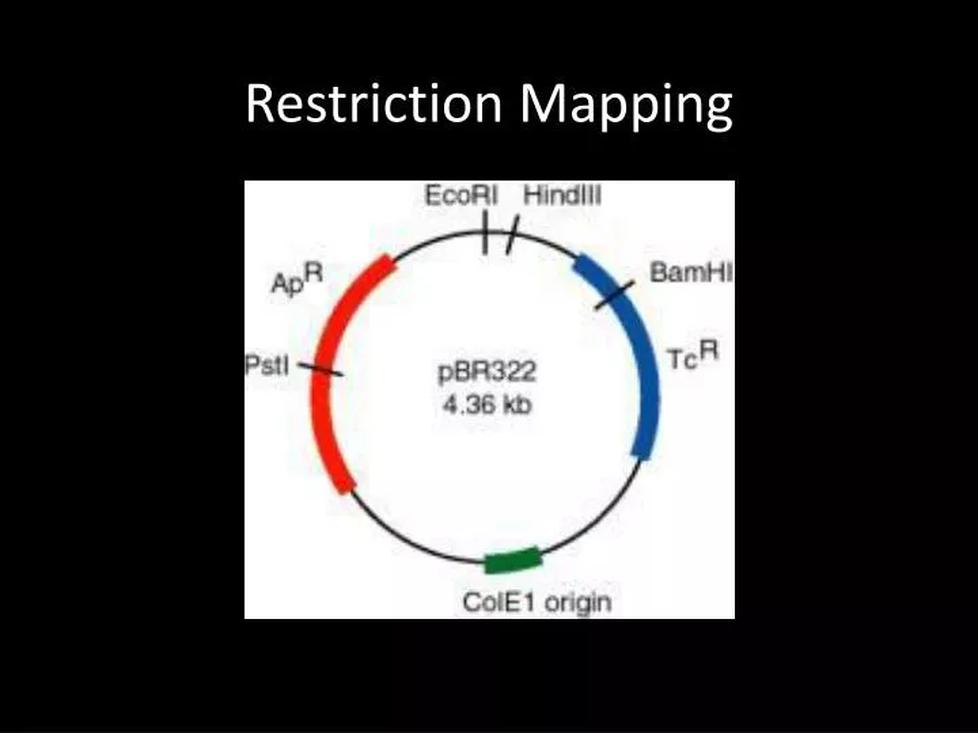
- Start by drawing a circular map of the original plasmid, marking EcoRI and PstI sites.
- Add the cloned insert sequence and place two new PstI sites according to inferred distances from fragment sizes.
- Use fragment sizes and enzyme combinations to verify the positions.
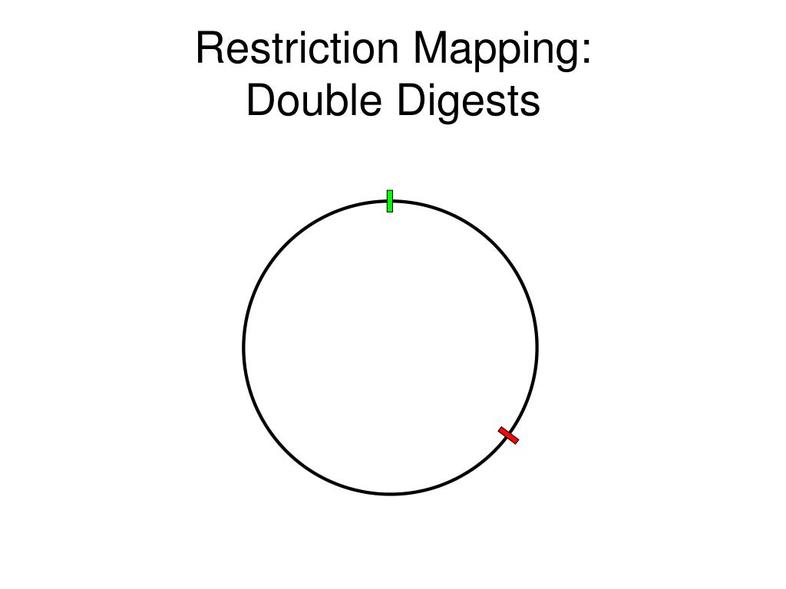
- Iterate and adjust your map, using the fragments produced from double digests for confirmation.
Step 4: Using Additional Resources and Strategies
Restriction mapping requires trial and error and spatial reasoning. Visual aids help greatly. Create clear maps, mark distances, and check for consistency with fragment sizes.
Watching explanatory videos, such as this tutorial, often clarifies the approach and common pitfalls.
Remember, start with known sites (EcoRI), then add complexity by analyzing unknown sites introduced by the insert.
Key Takeaways
- Begin with the original plasmid’s restriction sites and fragment sizes for a reference map.
- Identify new restriction sites from fragment sizes after digestion with other enzymes.
- Draw a circular plasmid map and position sites using fragment length data.
- Use double digests and fragment overlap to confirm site placement.
- Be patient and iterative—restriction mapping improves with practice and visualization.
I Need Helping Solving This Restriction Mapping. No Clue Where to Start 😪
Restriction mapping can feel like decoding a secret message, especially when you’re staring blankly at those fragment sizes and enzyme sites. If you’re asking yourself, “Where do I even begin with this 5 kb plasmid, EcoRI, and PstI puzzle?” — you’re in good company. Let’s unravel this mystery step-by-step with some clarity and a sprinkle of humor. Spoiler alert: it *is* fun once you get the hang of it!
First Things First: What’s This Plasmid Story?
You start with a 5 kilobase (kb) circular plasmid. Initially, the plasmid has exactly one EcoRI site. Nothing fancy there. But then you clone a 4.2 kb fragment into this plasmid, again using EcoRI digestion.
Here’s the kicker: when you cut the new plasmid with EcoRI, you get two fragments — one of 5 kb (the original plasmid backbone) and one of 4.2 kb (the insert). The total still adds up to 9.2 kb because plasmids don’t lose or gain DNA magically.
This basic fact sets the foundation of your map. You have two EcoRI sites now — one in the backbone, one at each end of the insert, since EcoRI was used for cloning.
Now Enter PstI: The Plot Thickens
Okay, here’s where it gets tricky. Your original plasmid has a single PstI site located 0.5 kb clockwise from EcoRI, which means if you go the other way around the plasmid, it’s 4.5 kb away (because 5 kb – 0.5 kb = 4.5 kb).
When you digest the new plasmid with PstI, something interesting happens. Instead of two fragments (you’d expect just two sites if nothing changed), you get three fragments. This tells you that your new plasmid harbors three PstI sites: the original one plus two more contributed by the insert.
Let’s Talk Fragment Sizes — The Clues on the Table
One of those fragments measures 7.4 kb. Since the original plasmid’s PstI site is 4.5 kb from EcoRI, this means:
- 7.4 kb – 4.5 kb = 2.9 kb
This 2.9 kb segment represents the position of the first new PstI site inside the insert, measured from the plasmid’s original EcoRI site (clockwise direction).
But wait — what about the second PstI site in the insert? The other fragments you have are 1.1 kb and 0.7 kb. These add up to 1.8 kb, which presumably corresponds to the remaining distances between PstI sites in the insert region.
How to Approach the Mapping — No More Head Scratching
First off, grab a pencil and a clean sheet of paper. Start by drawing a circle representing your plasmid. Mark the EcoRI site and the PstI site you know on the original plasmid. Then, add the insert — a 4.2 kb piece attached at the EcoRI cut site.
Now place the two additional PstI sites you figured out at the correct distances on the insert, respecting that you have fragments of 2.9 kb, 1.1 kb, and 0.7 kb inside it.
By mapping these fragment sizes as arcs on the vector map, you can spatially arrange all your cut sites.
Pro Tip: Combine Restriction Enzymes for More Clarity
If you have the liberty, digest the plasmid with a combination of enzymes, such as EcoRI plus PstI, or PstI plus another restriction enzyme. The resulting pattern of fragments can help you pinpoint the exact locations of cut sites on the insert and plasmid.
Sometimes seeing which fragments join or split after a double digestion reveals mysteries one by one. It might feel like detective work but with DNA instead of detective stories.
Patience Is Your Best Lab Partner
Restriction mapping is not about grabbing the answer in one gulp. It’s about biting piece by piece, chewing through data, and fitting puzzle pieces logically. Mistakes are okay — they mean you’re trying and learning.
Plus, every round of drawing and redrawing enhances your understanding of plasmid architecture and enzyme behavior. Trust me, it’s worth it.
Helpful Resources: A Little Cheer and Guidance
To make things even clearer, this video tutorial explains restriction mapping with similar examples and stepwise logic. Sometimes watching a concept unfold visually can add a new level of comprehension.
Final Advice: Start Small, Build Up
Begin by mastering the EcoRI sites and their role in the plasmid and insert. Once you have that piece firmly set, bring in the PstI sites. Use that vector map as your canvas. Draw circles, engrave cut sites, and measure fragment lengths carefully.
Every time you take a new enzyme digestion result and overlay it onto your existing map, the picture becomes clearer. Before you know it, you’ll feel like a plasmid whisperer—trust me, it’s a title you want.
Remember:
- This plasmid is always 9.2 kb total.
- The original plasmid has only one EcoRI and one PstI site.
- After insert cloning, you get additional PstI sites in the insert: two, based on your restriction digest pattern.
- Fragment sizes are your clues to map the sites.
- Drawing helps you visualize and avoid confusion.
So, ditch that 😪 face! You’ve got all the tools and strategies you need. The key is to pace yourself, use detailed fragment data, and trust the logic behind enzyme cuts. Soon, your restriction map will be looking snazzy and scientifically satisfying!
Now, isn’t restriction mapping just a little less mysterious?
How do I begin solving a restriction mapping problem with EcoRI?
Start by identifying how many EcoRI sites are in the original plasmid. Note fragment sizes after digestion. Use these sizes to establish the basic map before adding other enzymes.
What does it mean if I get three PstI fragments after digestion?
If the original plasmid has one PstI site, getting three fragments means the insert adds two more PstI sites. Use fragment sizes to locate these new sites based on distances from known points.
How can I find unknown restriction sites on the insert?
Analyze fragment lengths from single and double digestions. Draw maps step-by-step, placing sites based on fragment sizes. Trial and error helps clarify site positions.
Why is drawing a plasmid map important in restriction mapping?
Drawing a vector map visually organizes cut sites and fragment sizes. It helps you track enzyme sites and the order of fragments. This makes it easier to spot inconsistencies.
What if I am stuck and can’t place a restriction site accurately?
Try combinations of enzymes on the plasmid and insert. Compare fragment sizes in these digestions to narrow down possible site placements. More data reduces guesswork.
Are there resources to help me understand restriction mapping better?
Watch tutorial videos explaining digestion and mapping strategies. Visual aids and stepwise examples can clarify concepts and guide your problem solving.


Leave a Comment